
Home Assistant: Sending tomorrows flexible energy prices through a push notification
I’ve noticed a behaviour pattern on myself: Usually between 14-15 I do check few times from Home Assistant UI if tomorrow electric prices are already published to see how it looks. To save time and money, I decided to make an automation that will send me the flexible energy price data through Home Assistant as soon as the prices are new received by Nord Pool integration.
There’s a problem though. As the data is very much graphical presentation and describing it through text would make it unreadable and unnecessary long. Also it’s not possible take screenshot of already configured apex charts graphical chart so we will need to generate a new one for this case.
On this article I will be creating a new graphical presentation of the Nord Pool price data locally and sending it as push notification to my mobile. Leveraging the usage of pyscript, automations and Home Assistant companion app.
Hox! The nord pool integration I’m using here is the custom component, not Home Assistant official nord pool integration!
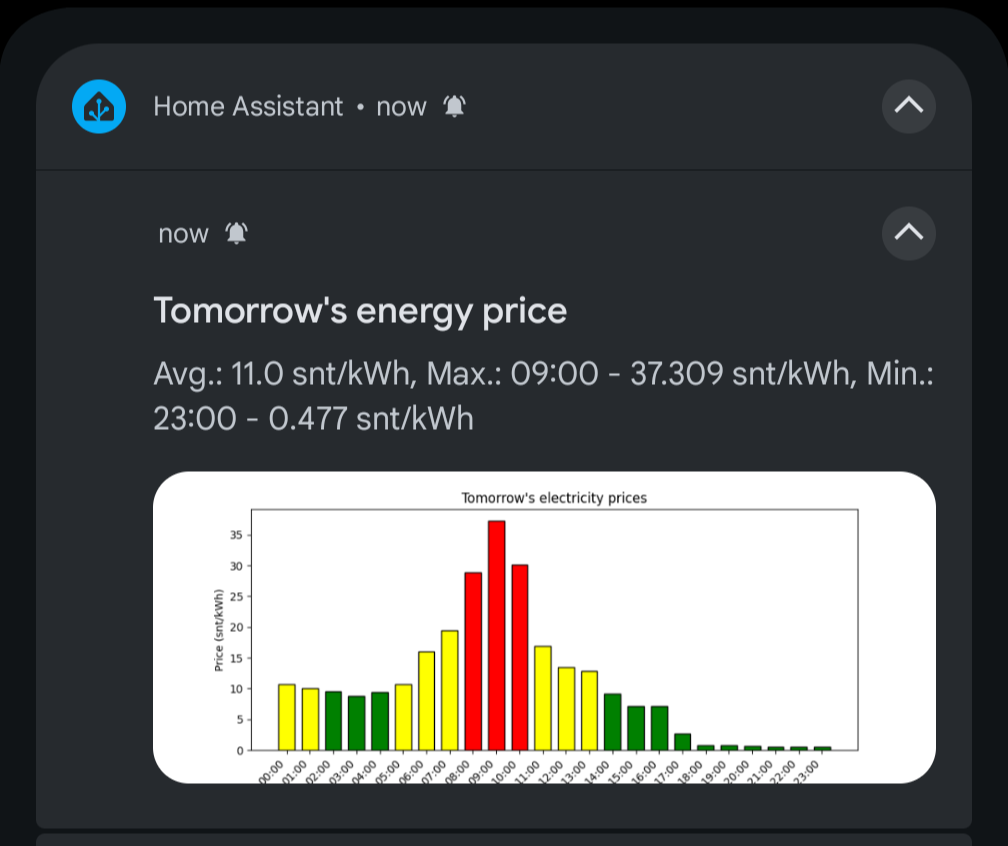
Image generation
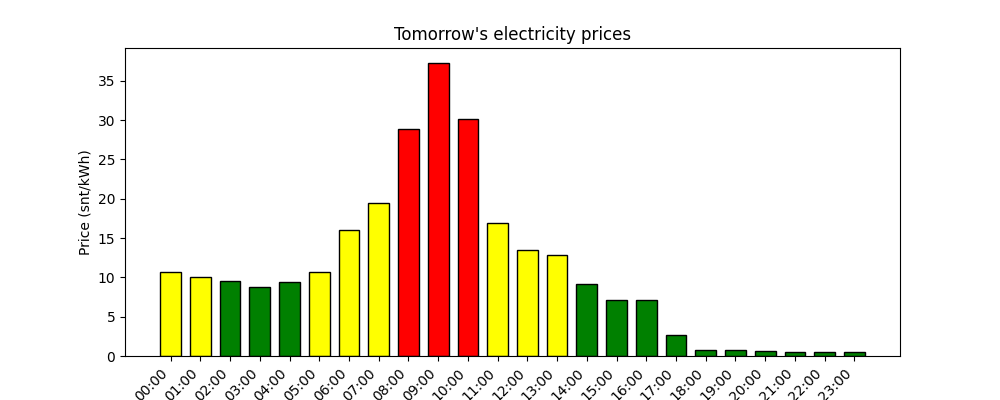
First thing to do is to generate a nice looking chart from the next day price data. Currently Home Assistant itself does not have the functionality to generate images easily. What we are going to use here is pyscript. PyScript for Home Assistant is a custom integration that allows you to write Python scripts to automate and control your smart home devices, e.g. scripts written in python 🙂
Home Assistant itself has the pyscript integration built-in, but unfortunately, with that we can’t use any external libraries. With pyscript custom component we can do that as well. So start by going to the pyscript custom component GitHub repository and install it through HACS (or manually if you wish). All the setup details are written down in the repository.
After Pyscript is installed through HACS, configure it on your Home Assistant configuration.yaml to allow external imports like this:
pyscript:
    allow_all_imports: true
    hass_is_global: true
Scripts written for pyscript should all be placed in the ‘config/pyscript‘ directory in Home Assistant filesystem. So create ‘pyscript‘ directory under config using file browser add-on or similar.. or even with SSH if you are familiar with it.
Once the pyscript is installed and folder created, it’s time to make the script to generate image from Nord Pool information. With this script we are using ‘matplotlib‘ library as our image generation library. Matplotlib is a Python library for creating static, interactive, and animated visualizations in Python.
External libraries required by pyscripts need to be listed in ‘requirements.txt‘ file under the pyscript directory. So create requirements.txt and add matplotlib there. If you have already been using pyscript just add the matplotlib at the end of the file unless it’s already there.
Here’s content of my ‘requirements.txt‘:
matplotlibOnce in place, we’ll create the plotting script called ‘plot_energy_price_graph‘. So create a file called ‘plot_energy_price_graph.py‘ with following content in the same pyscript directory:
import matplotlib.pyplot as plt

@service
def plot_energy_price_graph(data, filename='graph.png'):
  """
  Plots a graphical representation of an array of numbers and saves it as a PNG image.

  Args:
    data: A list or array of numbers.
    filename: The name of the file to save the graph to.
  """
  do_plot_graph(data, filename)

@pyscript_executor
def do_plot_graph(data, filename):
  time_strings = [f"{hour:02d}:00" for hour in range(24)]
  plt.figure(figsize=(10, 4))
  colors = []
  for value in data:
    if value < 10:
      colors.append("green")
    elif value < 25:
      colors.append("yellow")
    else:
      colors.append("red")
  plt.xticks(rotation=45, ha="right")
  plt.bar(time_strings, data, color=colors, edgecolor="black", width=0.7)

  plt.xlabel("Time")
  plt.ylabel("Price (snt/kWh)")
  plt.title("Tomorrow's electricity prices")

  plt.savefig(filename)
  plt.show()
  plt.close()
That’s it, we’ve just created a new pyscript service to plot image from a custom data. Just reboot the Home Assistant or use developer tools to ‘reload pyscript scripts’ if you’ve already rebooted after installing the pyscript integration.
You also might want to modify the data inside. I’ve set the energy price data to contain different colors for different price limits. You can also play around with other parameters as well like edge colors, title values, etc.. experiment or use what I have 🙂
Making the automation
Now finally into the automation part. I’m using nord pool data in here, but it most likely works fine with the data from Entso-e integration as well. Just keep in mind that Entso-E data might need some pre-treatment first, but the key point here is that the passed data points are in a single float array.
I will now go through all the steps for the automation separately. You can also get the whole automation code at the end of this section.
Trigger
So, when using nord pool data, we want to trigger it as soon as nord pool data is available for Home Assistant. So triggering on nord pool attribute tomorrow_valid = true.
My nordpool entity id here is just ‘nordpool’.
trigger: state
entity_id:
  - nordpool
attribute: tomorrow_valid
from: false
to: true
Note! Please make sure your trigger values are booleans (false and true) instead of string. Using Home Assistant automation editor UI will force those attributes to be in string format (‘true’ and ‘false’). So, edit the trigger in yaml!
Image generation
Now we are going to call our new image generation! In the image generation parameters we are going to pass the nord pool price data for tomorrow and filename + path that is required when sending the push notification.
Filename should contain the full path where it’s stored in Home Assistant environment. I’m using the ‘media‘ folder here and filename is ‘energy_price_graph.png‘.
action: pyscript.plot_energy_price_graph
data:
  data: "{{ states.sensor.nordpool.attributes.tomorrow }}"
  filename: /media/energy_price_graph.png
enabled: true
Since the pyscript we created is asynchronous function, we will wait few seconds before proceeding to the next action. Using this we give some time for the pyscript to generate the image itself. Again, you might want to tune it up or down, depending on the device you are running your Home Assistant. I’m using just five seconds here.
delay:
  hours: 0
  minutes: 0
  seconds: 10
  milliseconds: 0
Creating summary text
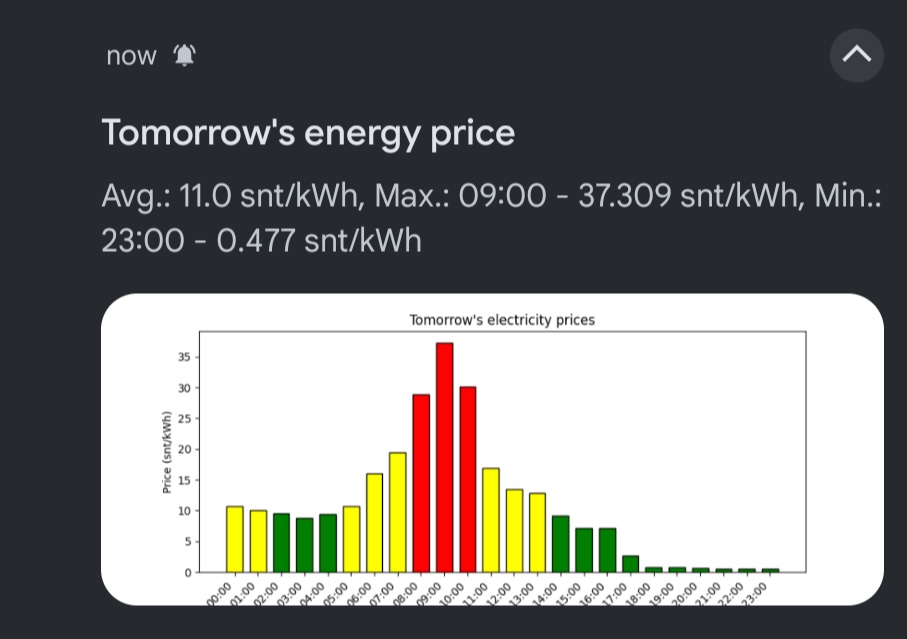
Even though the image will tell you much about the upcoming electric prices, I still wanted a bit more. I wanted the maximum price and minimum price with their exact times to be readable form the push notifications along with the average price of the full upcoming day.
Calculating those and constructing the text is be done at the same action as push notification sending itself. Here’s the template I’m using:
{%- set data = states.sensor.nordpool.attributes.raw_tomorrow %}
{%- set min_value = data | map(attribute='value') | min %}
{%- set min_element = (data | selectattr('value', 'equalto', min_value) | list)[0] %}
{%- set max_value = data | map(attribute='value') | max %}
{%- set max_element = (data | selectattr('value', 'equalto', max_value) | list)[0] %}
{%- set avg = states.sensor.nordpool.attributes.tomorrow | average %}
Avg.: {{ avg | round(2) }} snt/kWh, Max.: {{ max_element.start.strftime("%H:%M") }} - {{ max_value }} snt/kWh, Min.: {{ min_element.start.strftime("%H:%M") }} - {{ min_value }} snt/kWh"
Sending the push notification
Push notification parameters can contain images and text. Just remember when using hero image along with the text, maximum length for Android push notification is limited only to 55 characters.
So, we are going to send image, text and title to our phone.
With images, when using images from media folder, the path needs to start with ‘local‘ prefix. That’s how it’s used by the Home Assistant core.
Our action here is notify. Replace the entities with your own of course. I’ve used url and clickAction here to point my Home Assistant energy dashboard directly instead of just opening Home Assistant app (default). Url and clickAction are exactly the same, but url is used on iPhones and clickAction on Androids. You can delete those lines if you just want the click to open Home Assistant on your default dashboard.
action: notify.mobile_app_pixel_9_pro_xl
data:
  title: "Tomorrow's energy prices"
  message: "Our previous message goes here.."
  data:
    image: /media/local/energy_price_graph.png
    url: /room-based/electricity
    clickAction: /room-based/electricity
enabled: true
The whole automation
Finally the thing you all probably wanted all along, the full automation that can be copy-pasted. Just rename your entities to match yours 🙂
alias: "Utility: Notify about tomorrow's electric prices"
description: "Sends push notification with data once tomorrow's electric prices are published"
triggers:
  - trigger: state
    entity_id:
      - sensor.nordpool
    attribute: tomorrow_valid
    from: false
    to: true
conditions: []
actions:
  - action: pyscript.plot_energy_price_graph
    data:
      data: "{{ states.sensor.nordpool.attributes.tomorrow }}"
      filename: /media/energy_price_graph.png
    enabled: true
  - delay:
      hours: 0
      minutes: 0
      seconds: 10
      milliseconds: 0
  - action: notify.mobile_app_pixel_9_pro_xl
    data:
      title: "Tomorrow's energy prices"
      message: >-
        {%- set data = states.sensor.nordpool.attributes.raw_tomorrow %}
        {%- set min_value = data | map(attribute='value') | min %}
        {%- set min_element = (data | selectattr('value', 'equalto', min_value) | list)[0] %}
        {%- set max_value = data | map(attribute='value') | max %}
        {%- set max_element = (data | selectattr('value', 'equalto', max_value) | list)[0] %}
        {%- set avg = states.sensor.nordpool.attributes.tomorrow | average %}
        Avg.: {{ avg | round(2) }} snt/kWh,
        Max.: {{ max_element.start.strftime("%H:%M") }} - {{ max_value }} snt/kWh,
        Min.: {{ min_element.start.strftime("%H:%M") }} - {{ min_value }} snt/kWh"
      data:
        image: /media/local/energy_price_graph.png
        url: /room-based/electricity
        clickAction: /room-based/electricity
    enabled: true
mode: single
Conclusion
That’s it. Don’t know if it’s really useful or not, but those who want to know the data immediately it might be a good way to go 🙂
During the creation of this automation I’ve learned a lot about pyscripts. Most probably I will be using it more from now on with advanced automations later on. It provides much more possibilities than regular Jinja2 YAML.
Hello,
Thank You for your excellent articles and components.
I am just a little confused about the image, name and location. You refer to it(?) with:
– filename=’graph.png’
– filename: /media/energy_price_graph.png
– image: /media/local/energy_price_graph.png
Could You please explain a little bit more?
Thank You in advance!
Excellent question and I’m h happy to give you a more detailed explanation 🙂
filename='graph.png'This is inside the python code and defines the default name used as filename if not passed. So if we omit the filename from the service call, ‘graph.png’ will be used. In this case, this ‘graph.png’ has not effect obviously
/media/energy_price_graph.pngThis is the filename + path as seen inside the Home Assistant. It’s the default ‘My Media’ folder that can be browsed using Home Assistant ‘media’ functionality.
/media/local/energy_price_graph.pngThis is the same folder as above, but as seen by Home Assistant system when requesting files through filesystem functions. For some reason Home Assistant developers have decided to add the extra ‘local’ there.
Hope this clears things up 🙂
Hi Toni!
Thank You for Your explanation, which was good.
Trying to set this up tomorrow.
Cheers!
Hi Toni!
I tried all day to get this pyscript working, but no luck. I am on HA Core 2025.2.4.
First the “requirements.txt”, with matplotlib as only requirement, throws an error.:
2025-02-20 21:03:52.874 INFO (MainThread) [homeassistant.requirements] Multiple attempts to install matplotlib failed, install will be retried after next configuration check or restart
Second the pyscript.plot_energy_price_graph cannot be found, even if in “config/pyscript” throws an exception:
2025-02-20 22:09:10.509 ERROR (MainThread) [custom_components.pyscript.file.plot_energy_price_graph] Exception in line 2 (import matplotlib.pyplot as plt):
2025-02-20 22:09:20.248 ERROR (MainThread) [homeassistant.components.automation.utility_notify_about_tomorrow_s_electric_prices] Utility: Notify about tomorrow’s electric prices: Error executing script. Service not found for call_service at pos 1: Action pyscript.plot_energy_price_graph not found
Any way, thank You for your time.
Did you configure your pyscript (HACS version) properly on HA configuration?
I skipped the configuration part as I though it would be enough to point to the repository.
Anyhow, if this is the case, I will definitely modify this post to contain the required configuration 🙂
So, add to the configuration.yaml these lines if not yet added:
pyscript:

    allow_all_imports: true

    hass_is_global: true
Ps. remember the indentations as copy-pasting from the blog might set them wrong.
Hi Toni!
As I thought that to receive message itself is the important thing, I left out all pyscript related:
conditions: []
actions:
– action: notify.mobile_app_iphone_XXX
data:
title: Tomorrow’s energy prices
This works nicely.
By the way, in Your “The whole automation” script, there is a small typo:
{%- set max_value = data |\_map(attribute=’value’) | max %}
(loose the \_)
You can use or not, an image of Your own like.
Cheers!
Thanks for spotting the typo. Home Assistant automation UI actually generates those once the automation is in place. So (in theory) it should work with those marks in place as well. Anyhow, removed now so thanks 🙂
And too bad you couldn’t get the pyscript to work. I will be adding python part of the feature to AIO Energy Management at some point. So if you are using the AIO Energy Management component you could get it sooner or later to work.
Nice, I suffer from the same habbit 🙂 , will give this a try!
One overall improvement, it would be great to get the data from you AIO integration into the graph as well as my next step is to see that I get a reasonable power save
That’s an awesome idea and now I’m ashamed I didn’t think of it myself 😀
That would make it possible to use AIO energy management optionally and the pyscript part would come obsolete for people using AIO Energy Management.
I will definitely add this functionality there. Thanks for the tip!
This is interesting. Without matplotlib in requirements.txt, pyscript loads fine. As soon as I add matplotlib, it won’t load anymore.
task_watchdog: got exception Traceback (most recent call last): File “/usr/src/homeassistant/homeassistant/requirements.py”, line 292, in _raise_for_failed_requirements raise RequirementsNotFound(integration, [req]) homeassistant.requirements.RequirementsNotFound: Requirements for pyscript not found: [‘matplotlib’].
Somehow I cannot install this specific library. I run HAOS on a Yellow. What’s your setup?
I’m using HAOS as well, but on a virtual machine through proxmox.
Have you configured the HACS pyscript on configuration.yaml to allow all imports?
pyscript:allow_all_imports: true
hass_is_global: true
I’ve not included this configuration on my article as I though it’s included in the pyscript GitHub page, but will add it now. 🙂
I have. But as soon as I add this module it breaks
Great post. I’ve been looking for a way to create graphs for notifications. I modified the pyscript a bit on my end to have 8 lowest prices as green bars and 8 highest prices as red.
# Sort prices and identify thresholds for bar colors
sorted_prices = sorted(data)
lowest_8 = sorted_prices[:8]
highest_8 = sorted_prices[-8:]
# Assign colors based on value
colors = [
“green” if v in lowest_8 else
“red” if v in highest_8 else
“orange”
for v in data
]